A few thoughts about Turkey.
The readers of this blog are a well-informed bunch, and I'm sure they know the basics. To wit: on May 31, protests were underway (peacefully) in Istanbul, where the catalyzing issue was the government's plan to replace a historical park with a shopping mall. Police responded that day in a heavy-handed way, tear gas, water cannon, 63 arrests. This has led to a spreading of the protests and a wider range of grievances, while Prime Minister Tayyip Erdoğan has asserted that he has the high ground, and called the protestors "hoodlums."
This is clearly about a good deal more than a single land-use dispute.
It reminds me of something I wrote in my book, Gambling with Borrowed Chips. I sought to explain an upswing in crude oil prices that began in April 2007 and that continued until the summer of 2008.
The world price of crude is of course very sensitive to news about the politics of the middle east. In April 2007, when the upward move in question got underway, the president of Iran, Mahmoud Ahmadinejad, said ... well, never mind that. Today's subject is Turkey.
By August 2007, the oil price may have been ready to settle down into a new equilibrium, except that it received another impetus on the up side. Voters in Turkey that month elected Abdullah Gül their new President. Gül remains in that post to this day and is, to put it roughly, Erdoğan's boss.
Gül's election was note-worthy because he was the first devout Muslim ever to become president of modern Turkey -- a country that since it came into being, in deliberate opposition to the ways of its Ottoman precursor state -- has had a decidedly secular political culture. This has allowed it to serve in many situations as a valuable bridge between the western and the Islamic worlds.
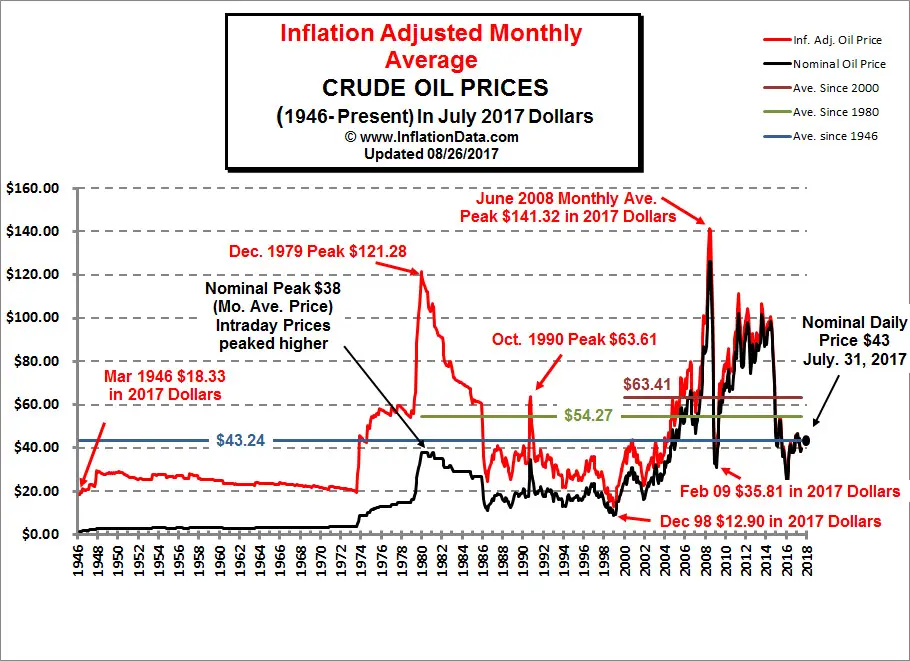
Gül, and the uncertainties that this new leader, this new type of leader, might introduce into the region was surely on the minds of traders for the remainder of 2007, and the price of crude oil continued its rise. It didn't stabilize until the summer of 2008, when it briefly ascended above the $91 per barrel mark before heading back down. In inflation-adjusted 2013 numbers, that means it peaked at $134.38.
The chart above gives the history of petroleum prices since 1946 [in 2013 dollars on the red line, in nominal dollars on the black line.] The sources is www.InflationData.com .
I draw your attention to the right hand side of the chart especially. You'll see that the red and black lines both peak in early 2008, and then precipitously decline. They recovered, reaching a lesser peak in 2010, and have since again declined somewhat.
My thesis: we are now, in Turkey, seeing the sort of event that Mr. Market was worried about in 2007-08. The actuality of what was then a dire possibility may well create another such spike.
This comment has been removed by the author.
ReplyDelete